The easiest way to check the GPU usage in Windows is through the Task Manager. It will show you how apps and games consume your GPU’s resources. Additionally, you can check things like real-time power consumption and fan speed of your GPU using a lightweight tool called HWiNFO. We show you how to use both.
Is your graphics card running too hot? Undervolt your GPU to reduce its operating temperature, save energy, and increase the card’s lifespan.
Check GPU Usage in Task Manager
Task Manager is one of the first programs you should refer to if you’re curious or concerned about your GPU usage on Windows. Besides the GPU, it also shows you real-time CPU, memory, and disk usage in a single pane. Task Manager also comes in handy to stop background apps and processes on Windows.
To begin, open Task Manager by pressing Ctrl + Shift + Esc. You can also right-click the Windows button and select Task Manager.
Viewing Total Usage
You’re likely to see the Processes tab after opening Task Manager. This is the tab that’s most referenced by PC users when faced with high memory usage or to simply check their CPU or disk usage. Something that’s missing here by default is the GPU usage.
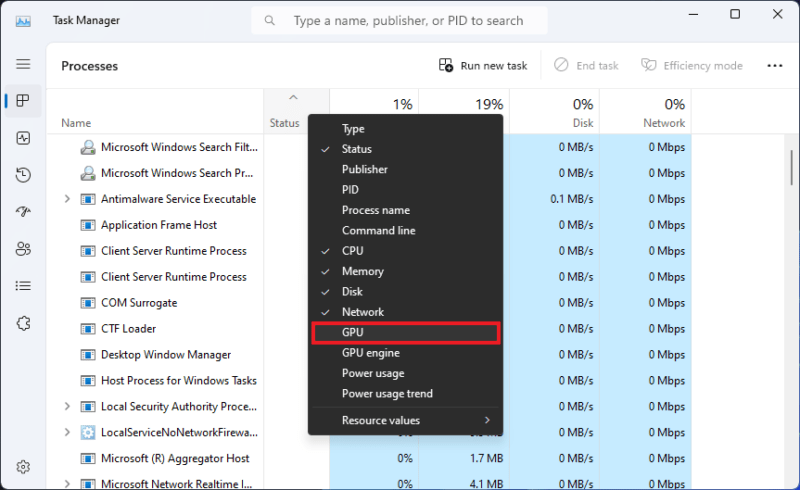
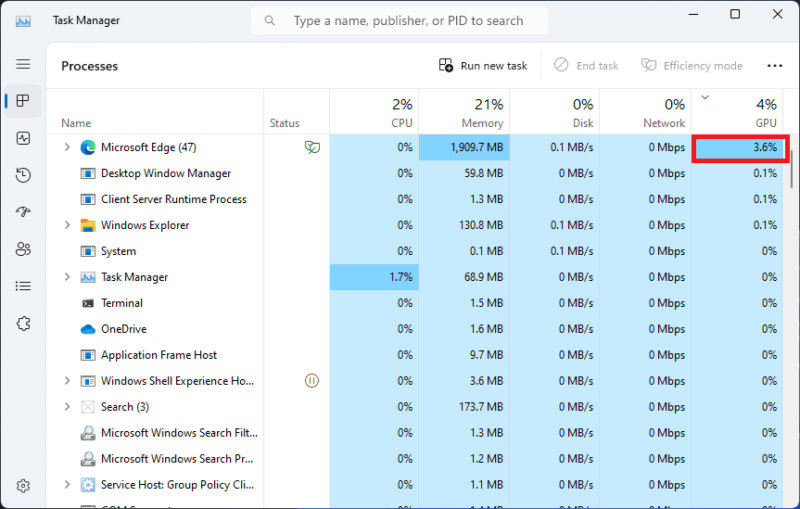
To enable GPU usage in the Processes tab, right-click anywhere on the column headers (Status, CPU, Memory, etc.), and select GPU.
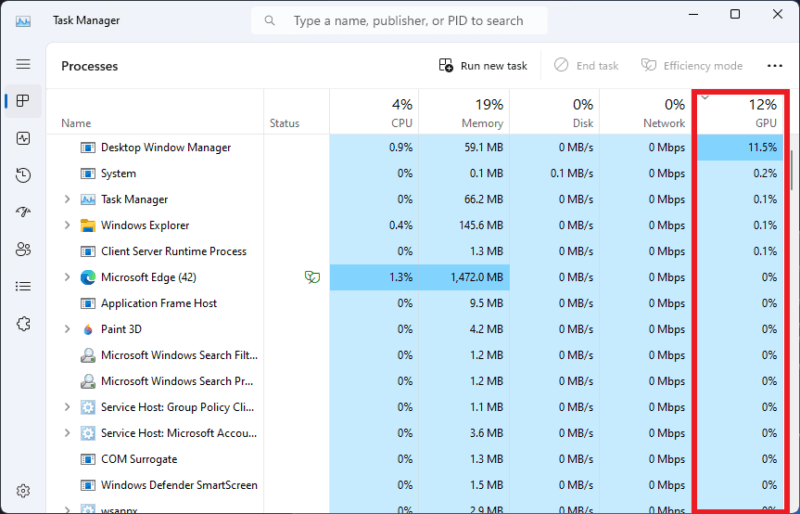
Next to CPU, Memory, Disk, and Network, you’ll now see a GPU column that shows the total GPU usage as a percentage at the very top.
If you want to see more details of how much stress your GPU is under, switch to the Performance tab using the icons on the left side of the window. The Performance tab shows you an overall summary of your hardware, including the GPU. If you click GPU on the left, you can see all the details on the pane on the right.
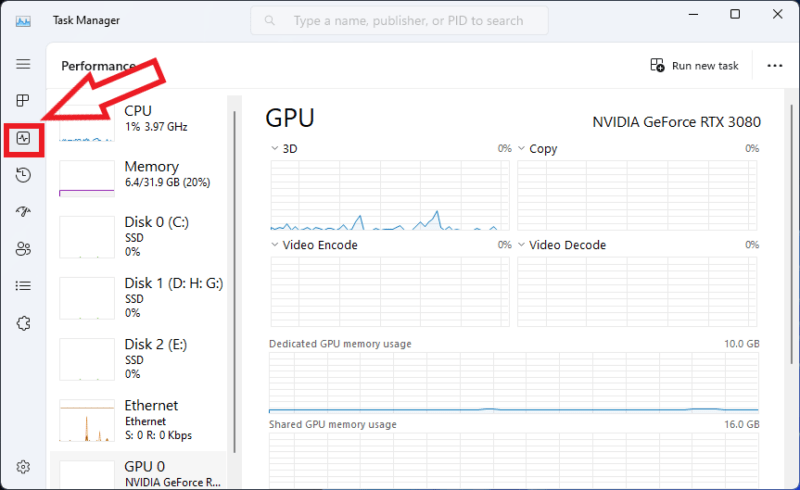
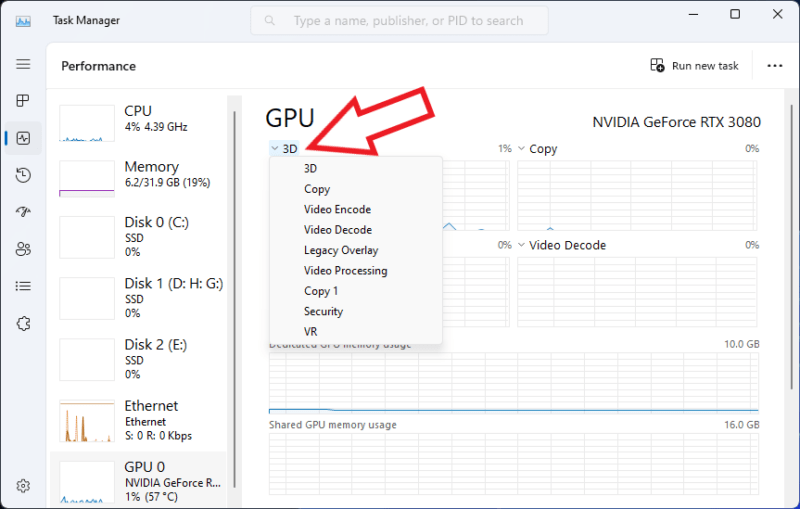
Each element of your GPU is split up into individual graphs to give you more insight into how your GPU is being used. If you want to change what’s being displayed, click the small downward arrow next to the title of each graph, and select the graph you want to check.
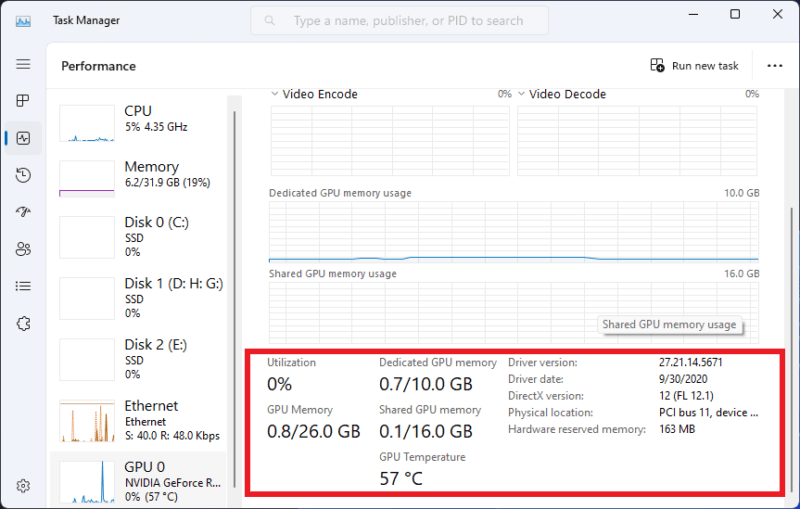
Besides total GPU usage and per-app GPU usage, Task Manager also shows you additional details about your GPU. The Performance screen shows you GPU memory usage, shared GPU memory, GPU temperature, and additional driver details.
FYI: learn about GPUs that match or outperform a PlayStation 5.
Viewing Usage Per App
While viewing total GPU usage is handy, you may want to see which application or process is using the highest amount of GPU resources on your system.
Switch back to the Processes tab. Click the GPU column header once to sort it from high to low. You can see the GPU usage per app, with the one consuming the highest GPU resources at the top.
This makes for a quick and easy way to see how hard specific apps are on your graphics processor.
Is something wrong with your graphics card? Whether you see artifacting, notice games are underperforming, or experience crashes, we help you troubleshoot your GPU.
Check GPU Power and Fan Speed in HWiNFO
Task Manager is incredibly helpful for viewing GPU usage and temperature, but it doesn’t offer any insight into GPU power consumption and fan speed. Besides these parameters and a whole lot more, HWiNFO allows you to see total GPU usage and GPU core usage.
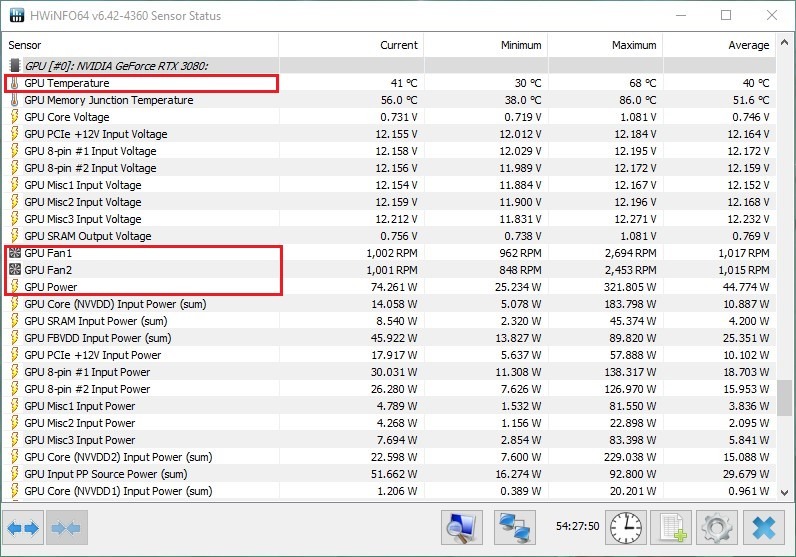
To begin, download HWiNFO and install or launch it (depending on whether you download a portable version or an installer). Launch the utility, and scroll down to the GPU section on the Sensor Status window.
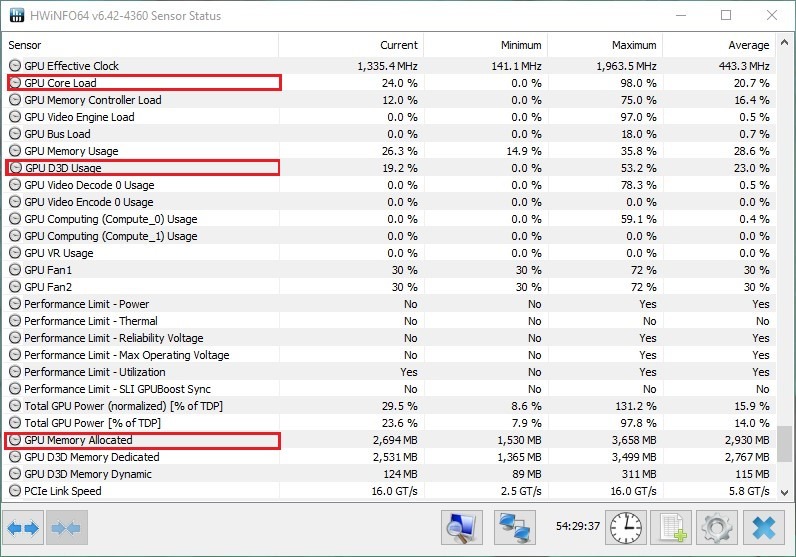
The real-time GPU temperature is at the top. A few rows below that are the fan speeds next to GPU Fan1, GPU Fan2, and more, in case you have more fans on your graphics card. Power consumption is listed as well, next to GPU Power. The Current, Minimum, Maximum, and Average columns make it easier to evaluate each of the parameters over time.
If you want to view the GPU usage in HWiNFO, you can do that too. Scroll down to the GPU D3D Usage row. This value is the one shown as the total GPU usage in Task Manager. Other rows, like GPU Core Load and GPU Memory Allocated, provide even more information about how much your GPU is being used.
Task Manager provides a quick and convenient way to see how much your GPU is being put to use and which games or applications are using it the most. Besides this built-in tool, you can check your PC health using third-party tools, like HWiNFO. It allows you a little more insight into your GPU usage and shows things not shown by Task Manager.
Image credit: Unsplash. All screenshots by Tanveer Singh.
Our latest tutorials delivered straight to your inbox