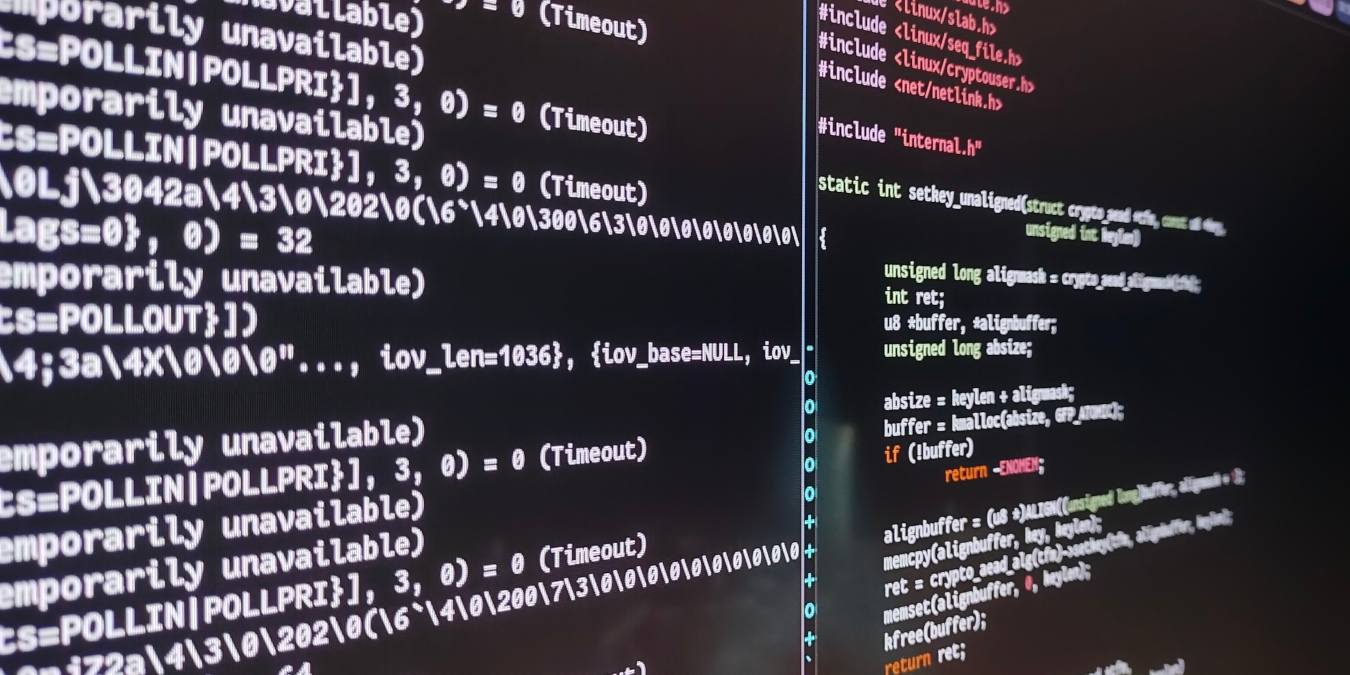
Debuggers are essential for locating bugs in programs. They do the legwork of attempting to find problems in your code before it’s time to compile it, usually providing more information than the compiler itself would. Linux, being a primarily open-source ecosystem, has a plethora of these types of applications that work on several different languages and processing architectures. In this guide, we’ll dive straight into the world of Linux debuggers.
1. GNU Debugger(GDB)
The GNU Debugger, aka GDB, is one of the most powerful Linux debuggers available to modern programmers. It is a robust tool with an extensive set of features. GDB supports many popular programming languages, including C, C++, Go, and Rust. It also works on many different CPU architectures, such as x86, x86-64, ARM, PowerPC, SPARC, and MIPS.
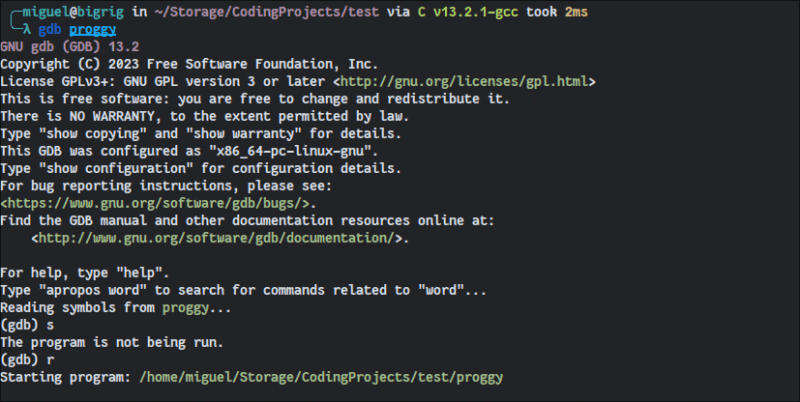
Install GDB using these commands:
In Ubuntu/Debian-based distros:
sudo apt install gdb
In Fedora/RHEL distros:
sudo dnf install gdb
In Arch-based distros:
sudo pacman -S gdb
As long as you compile using GCC with debug symbols, you can step through a program’s instructions as it runs by typing s. Typing r will run your program through the debugger. To start GDB with the program loaded, just type gdb in your terminal followed by the program path.
Once you’re in, typing help will give you a well-organized catalog explaining everything you can do with this all-powerful debugger!
2. Data Display Debugger (DDD)
If fiddling with commands isn’t your thing but you still love the features that GDB has to offer, DDD gives you a simple graphical front-end that provides all its features in a point-and-click interface. It’s the quintessential Linux debugger GUI.
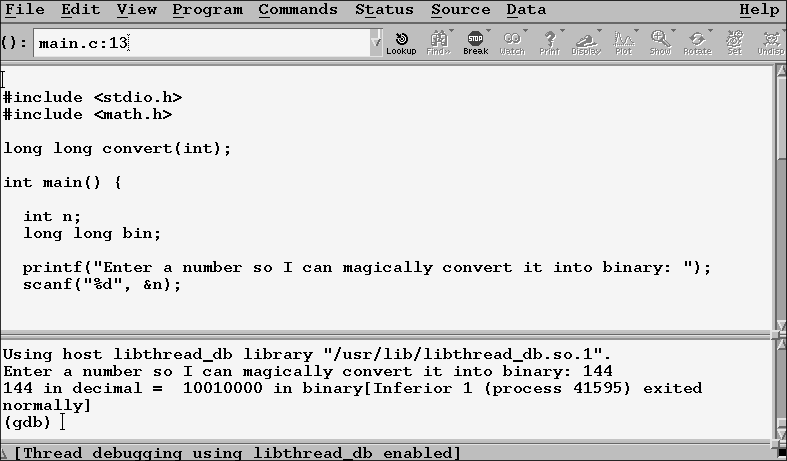
The UI may look a little bit barebones, but it is every bit as powerful as any other debugger. The difference here is that you get GNU’s signature debugger with a graphical interface!
To install it:
In Ubuntu/Debian-based distros:
sudo apt install ddd
In Fedora/RHEL distros:
sudo dnf install ddd
In Arch-based distros:
yay -S ddd
Anything Arch-based will have to use an AUR helper, as DDD does not exist in its official repositories. Alternatively, you can install DDD on an Arch-based system without an AUR helper:
sudo pacman -S --needed base-devel
git clone https://aur.archlinux.org/ddd.git
cd ddd
makepkg -si
3. LLDB
LLDB is part of the LLVM project. The LLVM suite has been gaining in popularity, thanks to its efficient workflow. It has also become the default debugger for macOS’s Xcode and Android Studio. Some of LLDB’s main features include support for various compiler integrations and remote debugging. It supports the C languages (C, C++, and Objective-C).

For those already familiar with basic GDB commands, LLDB will feel familiar. Typing run or r runs the program, and typing step or s steps through its subroutines.
To install it:
In Ubuntu/Debian-based distros:
sudo apt install lldb
In Fedora/RHEL distros:
sudo dnf install lldb
In Arch-based distros:
sudo pacman -S lldb
4. Delve
Delve is a simple, yet feature-rich, Linux debugger for Google’s Go programming language. You can use it to interact with your program in runtime and manipulate things like goroutines and stacks. The debugger itself is written in Go, thus providing a runtime in the same environment as the program you’re testing.

Delve operates on the same principle as GDB and LLDB save for the fact that it has a unique set of commands that differ greatly from the other two. Just type help once you’re in and you’ll have a full list of all the debug options it gives you.
Unlike more general debuggers for multiple languages, Delve offers more Go-specific commands that let you poke at a more granular level into your application as it runs.

To install it:
In Ubuntu/Debian-based distros:
sudo apt install delve
In Fedora/RHEL distros:
sudo dnf install delve
In Arch-based distros:
sudo pacman -S delve
5. Xdebug
While most people learn to dump their variables (known in PHP communities as “dump & die”) to find out what’s wrong with a certain aspect of their code, there are times when you need something more heavy-duty that can walk you through all of your routines. Xdebug offers this in spades for aspiring and veteran PHP programmers.

It’s a Linux debugger that steps through PHP code line by line and shows exactly what’s happening as a web page is processed. Xdebug also works on several IDEs, including VSCode. Its other features include a robust profiler, stack tracer, and the ability to dump the full execution segment.
To install Xdebug:
In Ubuntu/Debian-based distros:
sudo apt install php-xdebug
In Fedora/RHEL distros:
sudo dnf install php-xdebug
In Arch-based distros:
sudo pacman -S xdebug
6. KDbg
KDbg is a GUI debugger for the KDE desktop environment. Since it runs as a GDB front-end like DDD does, you get all the features of GDB alongside an intuitive user interface. More experienced programmers will certainly appreciate a clear view of all variables while stepping through their code as well as a completely dedicated panel showing what each CPU register is holding. This isn’t nearly as easy to visualize in any of the other debuggers covered here.
Because of this, KDbg is a fantastic choice for traditional native application programmers, from the tadpoles who are just starting to learn to the most hardened veterans.
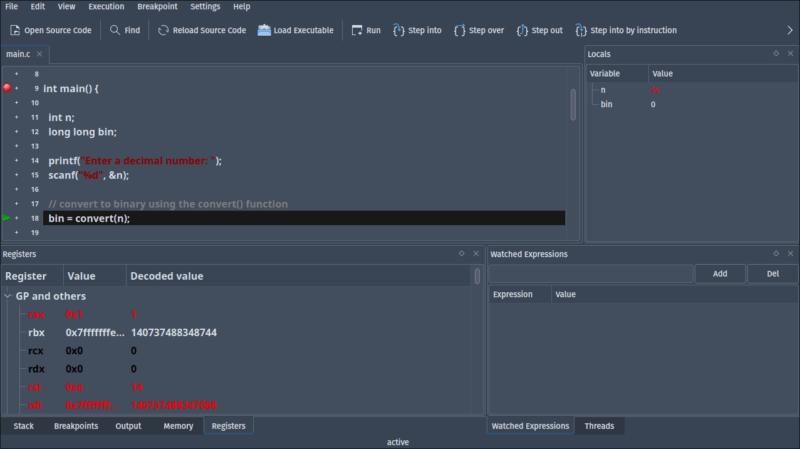
To install KDbg:
In Ubuntu/Debian-based distros:
sudo apt install kdbg
In Fedora/RHEL distros:
sudo dnf install kdbg
In Arch-based distros:
sudo pacman -S kdbg
Note: If you’re using an Ubuntu or Debian-based distro and don’t find the package for kdbg in official repositories, here’s exactly what you have to type to build it yourself:
sudo apt install build-essential cmake extra-cmake-modules qtbase5-dev libkf5i18n-dev libkf5iconthemes-dev libkf5xmlgui-dev
git clone -b maint https://github.com/j6t/kdbg.git
cd kdbg
cmake .
make
sudo make install
7. Valgrind
Valgrind is a rock-solid memory debugger that offers many additional tools for software analysis. It runs on both Linux and Mac. Moreover, you can use it as a framework and create dynamic analysis tools like profilers. Overall, Valgrind is an excellent choice for professionals due to its rich feature set and variety of tools that monitor a program’s memory while it runs.
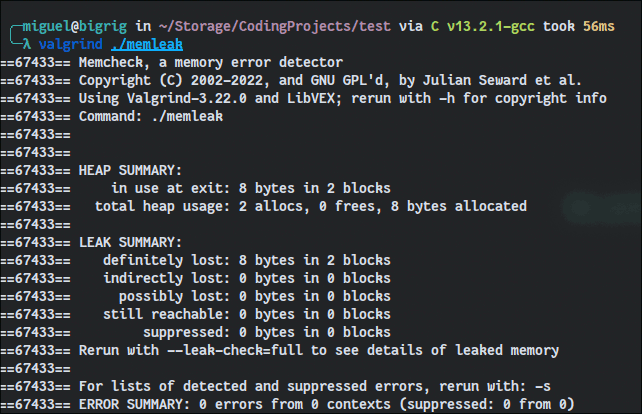
To install Valgrind:
On Ubuntu/Debian-based distros:
sudo apt install valgrind
On Fedora/RHEL distros:
sudo dnf install valgrind
On Arch-based distros:
sudo pacman -S valgrind
8. strace
strace is a userspace utility for Unix that allows users to trace system calls and signals directly from the terminal.

Programmers can use it to dump stack traces, filter system calls, modify return codes, extract file descriptors, and much more.
More importantly, strace allows you to attach to running programs. This lets you get under the fingernails of any software you run on your machine to learn more about what could be causing a crash.
To install strace:
In Ubuntu/Debian-based distros:
sudo apt install strace
In Fedora/RHEL distros:
sudo dnf install strace
In Arch-based distros:
sudo pacman -S strace
The Arsenal Awaits
With these tools, you can poke, prod, and analyze your code in ways that previously may have felt inaccessible. There may be a bit of a learning curve to follow, but it’s well worth it. If you’re serious about programming in Linux, learning how to use its debuggers will save you much more time in the long term.
Now that you have the best Linux debuggers, it is time for you to find the best Linux distros for developers and programmers.
Image credit: All images by author.
Our latest tutorials delivered straight to your inbox